NEW: Connectivity Manager — Now in the Asset Modal
Your connectivity information is now part of the map experience.
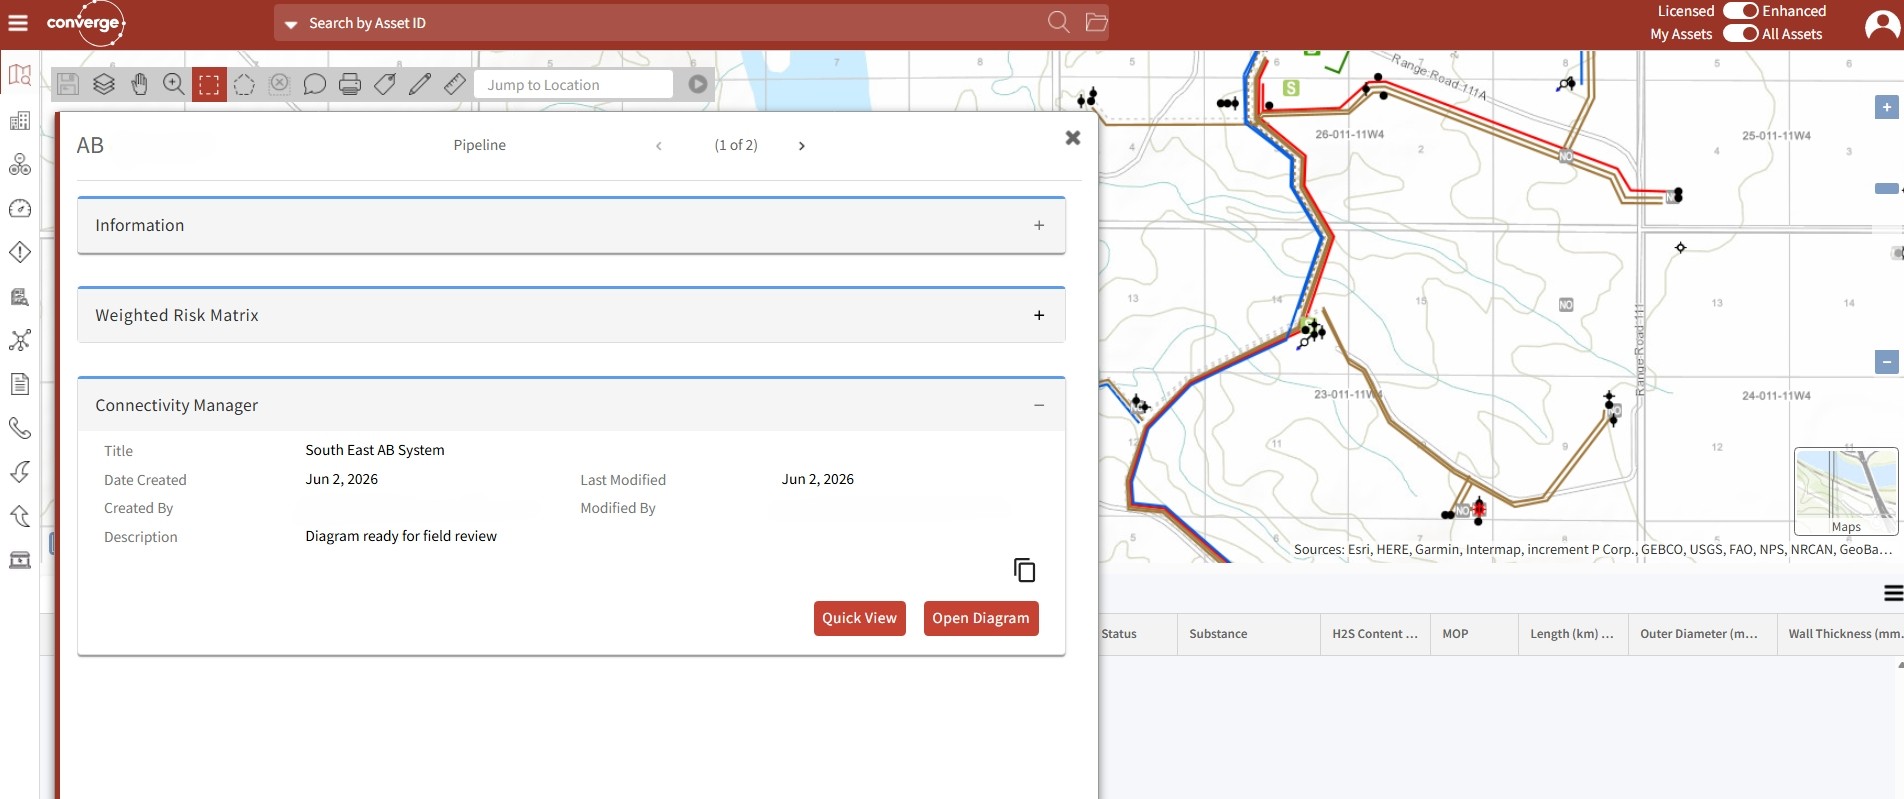
Integrity programs depend on knowing how your assets are connected. Connectivity Manager is now available directly in the Pipeline, Facility, and Well asset modals — so you can select any asset on the map and immediately know where it fits in your network.
- See which diagram an asset belongs to and preview it right in the modal
- Open the diagram in Connectivity Manager for full detail and management
- If an asset isn't in a diagram yet, launch Connectivity Manager to add it to a new diagram directly from the map
This feature is available to clients licensed for Connectivity Manager. Log in and try it today.
Not yet using Connectivity Manager? Reach out to support@gdm-inc.com to book a demo and see what complete connectivity visibility looks like for your program.